Plotted
Redistributing together
Team
Brandon Tam (Visual Lead and UX designer)
Rae Peterson (Project Manager and Visual Designer)
My role
Annie Shen (UX Lead and Visual Designer)
User research, concept direction, prototyping, wireframing, concept strategy, visual identity, visual design
Context
Design for Change
Adobe Creative Jam + SoDa Agencies
Mentors
Dana Herkelrath
Usman Fahimullah
Kimya Ramezani
Dani-Meluski Jimenez
Laura Cortez
Judges
Jess Sattell
Tom Beck
Anne Moertel
Overview
Many small family farms in the U.S. struggle to produce and sell their farm products, and 2.3 million households in rural communities struggle with food insecurity. Fresh untouched produce is thrown away and struggling families go without food — the cycle continues.
How can we reduce food waste and instead redistribute food to those in need?
The Objective
We created Plotted to be a tool for farmers, local neighbors, and markets to create partnerships to redistribute affordable produce.
Plotted allows small farmers to gain the opportunity to profit from their farm, keep track of their farm’s progress, all while supporting their local community.
My Role
I provided and assessed research regarding the reasons for food insecurity, what actions can be taken, as well as while how we can do so with sustainability in consideration. I also provided visuals and created graphic illustrations to give the app a touch of personality.
Firsthand Research Statistics
According to sources like Feeding America, rts, and fao:
Agriculture pollutes through fertilizers, methane from cows, and pesticides that harm soil, air, and water.
Food waste is massive — 40M tons/year in the U.S. alone.
Hunger is rising — 54M+ Americans now face food insecurity post-COVID.
Climate change + conflict worsen farming, food access, and global nutrition.
Key Insights
Soil/Crop Health is important in ensuring crops will be able to grow without threats being an issue for production rate.
Harvest Readiness can be announced so that nearby food banks that are seeking the crops are aware.
Distribution Farm Statistics are important for the farmer in understanding their farm and how redistribution has helped the community as a whole.
Information Architecture
The project lead visualized our identified aspects of food insecurity between small local farms, food banks, and food-insecure households. We also assessed when who can step in, and how they can contribute/benefit each other.
Wireframing
The visual lead collected our teams insights and ideas together and created a general visualization of what our ideas would look like in a mobile format.


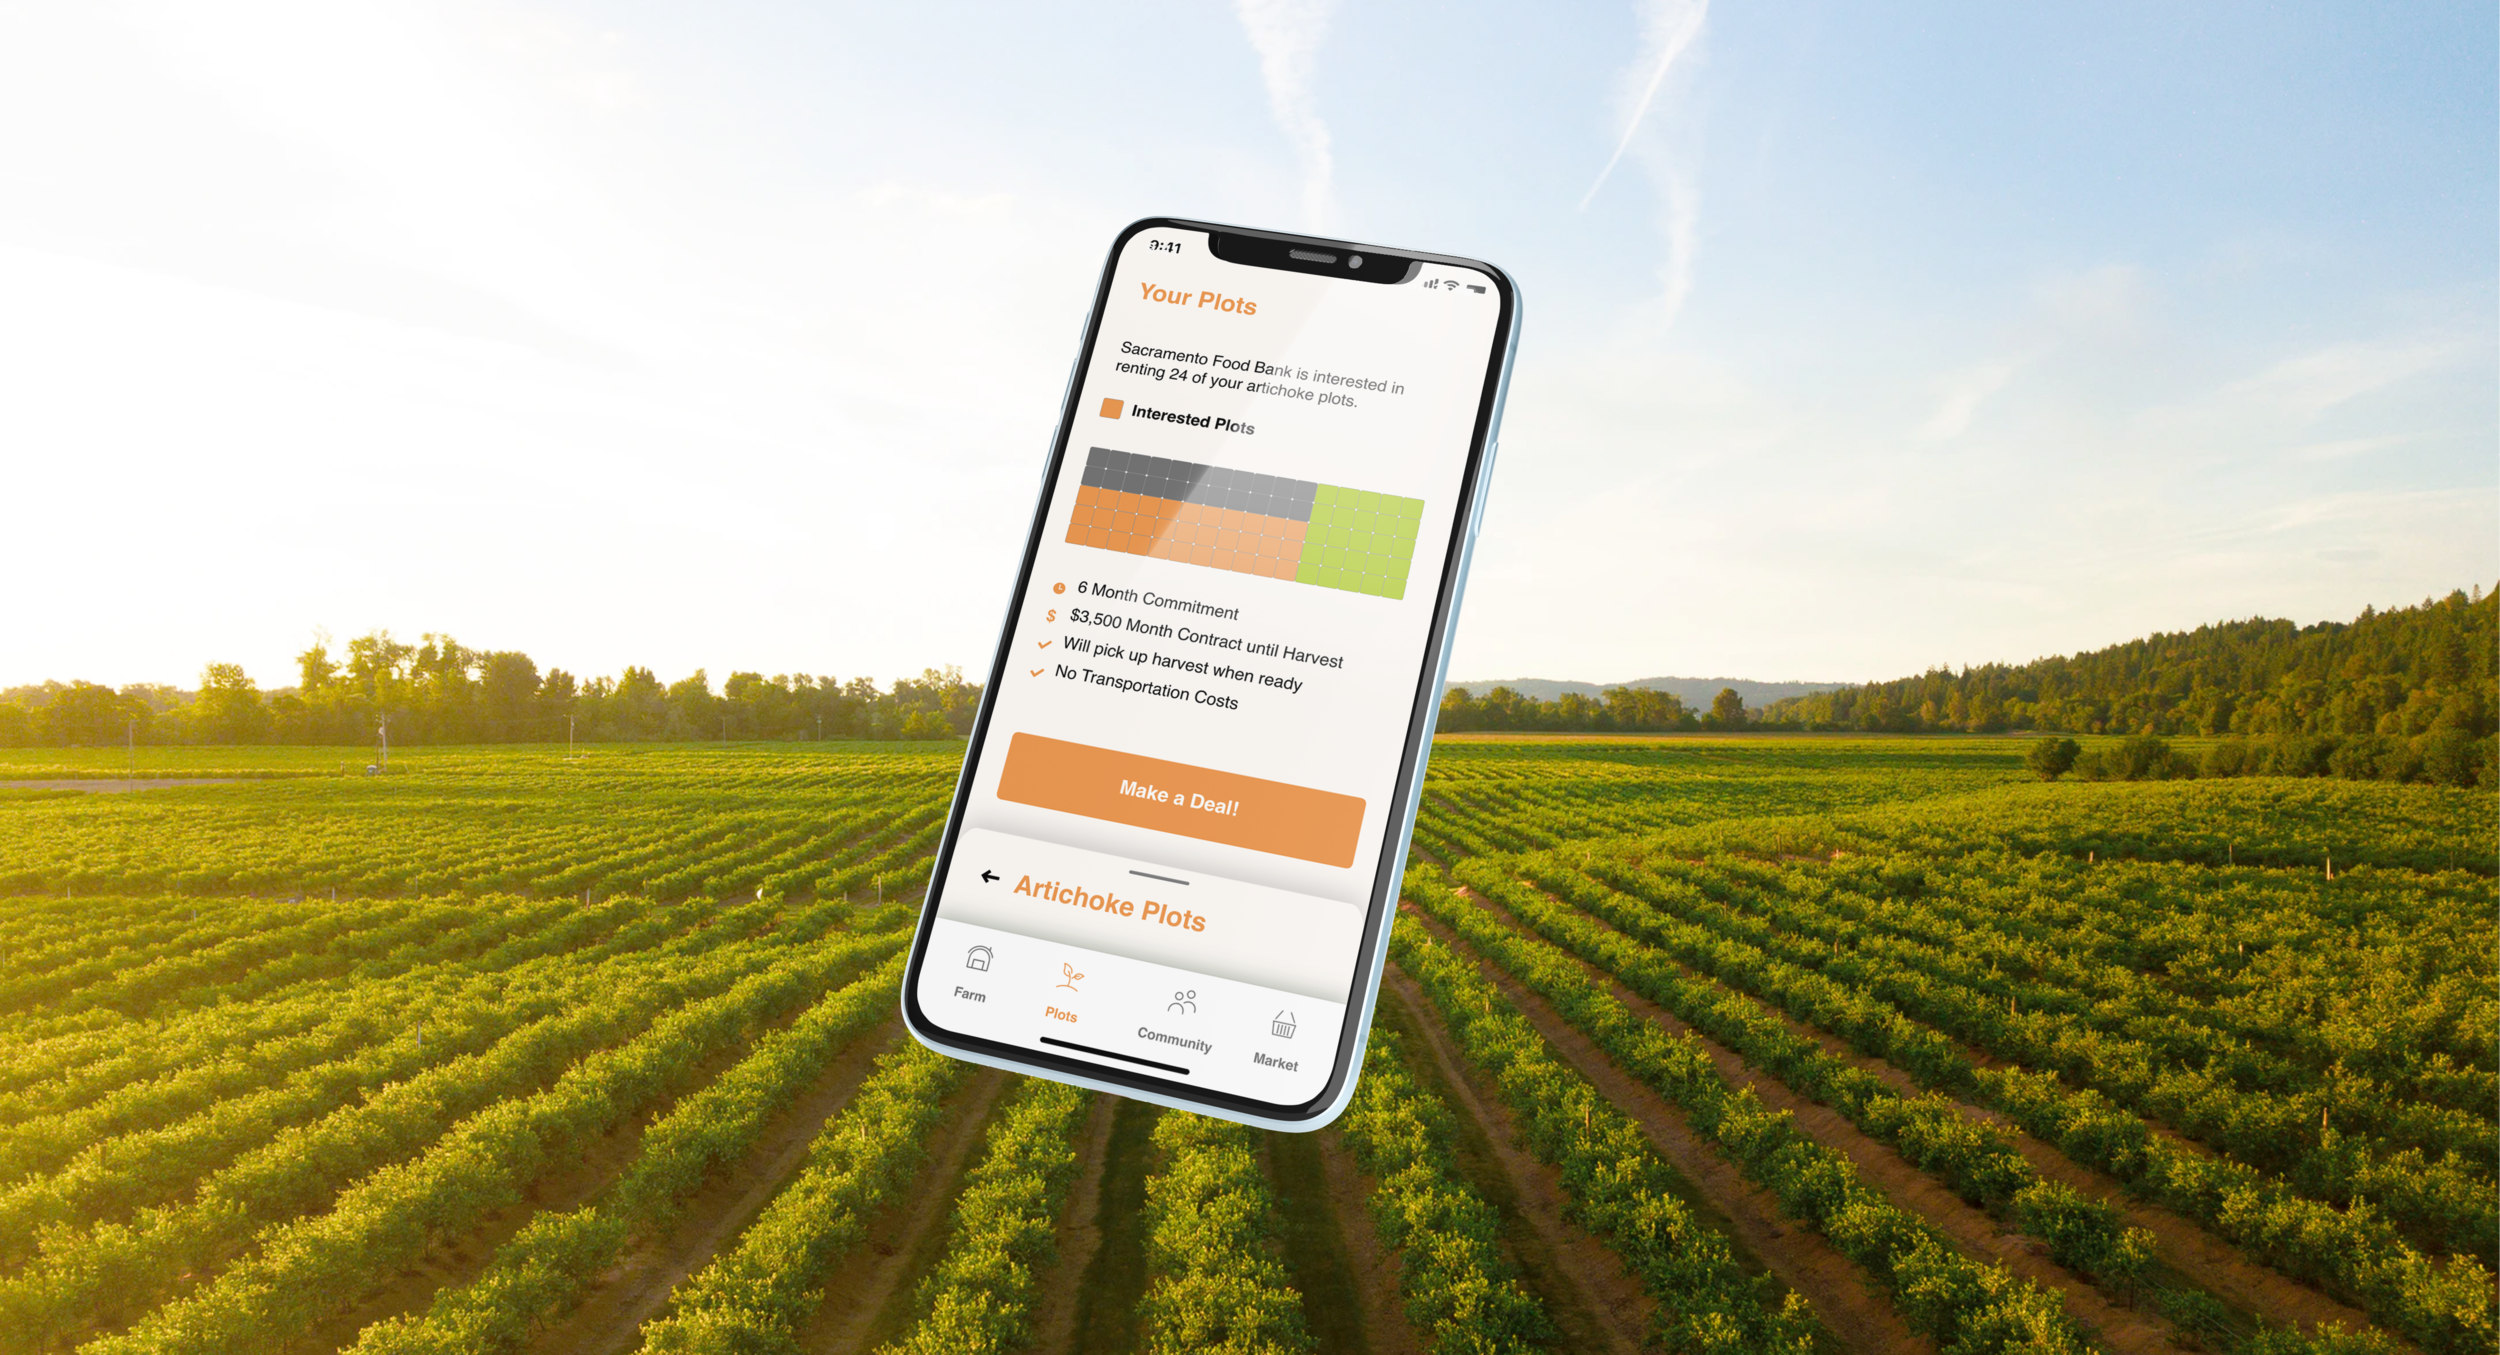
Farm Data
Keep track of important addresses on your trip. Then share your trip details and live location with friends.
The map shows any important resources, unsafe areas to avoid, or recent incidents.

Crop Health
View the plot’s health to see what improvements can be made and what is affecting the projected harvest date.

Harvest Readiness
Schedule redistribution by seeing which food banks are interested in their crops when they are ready.
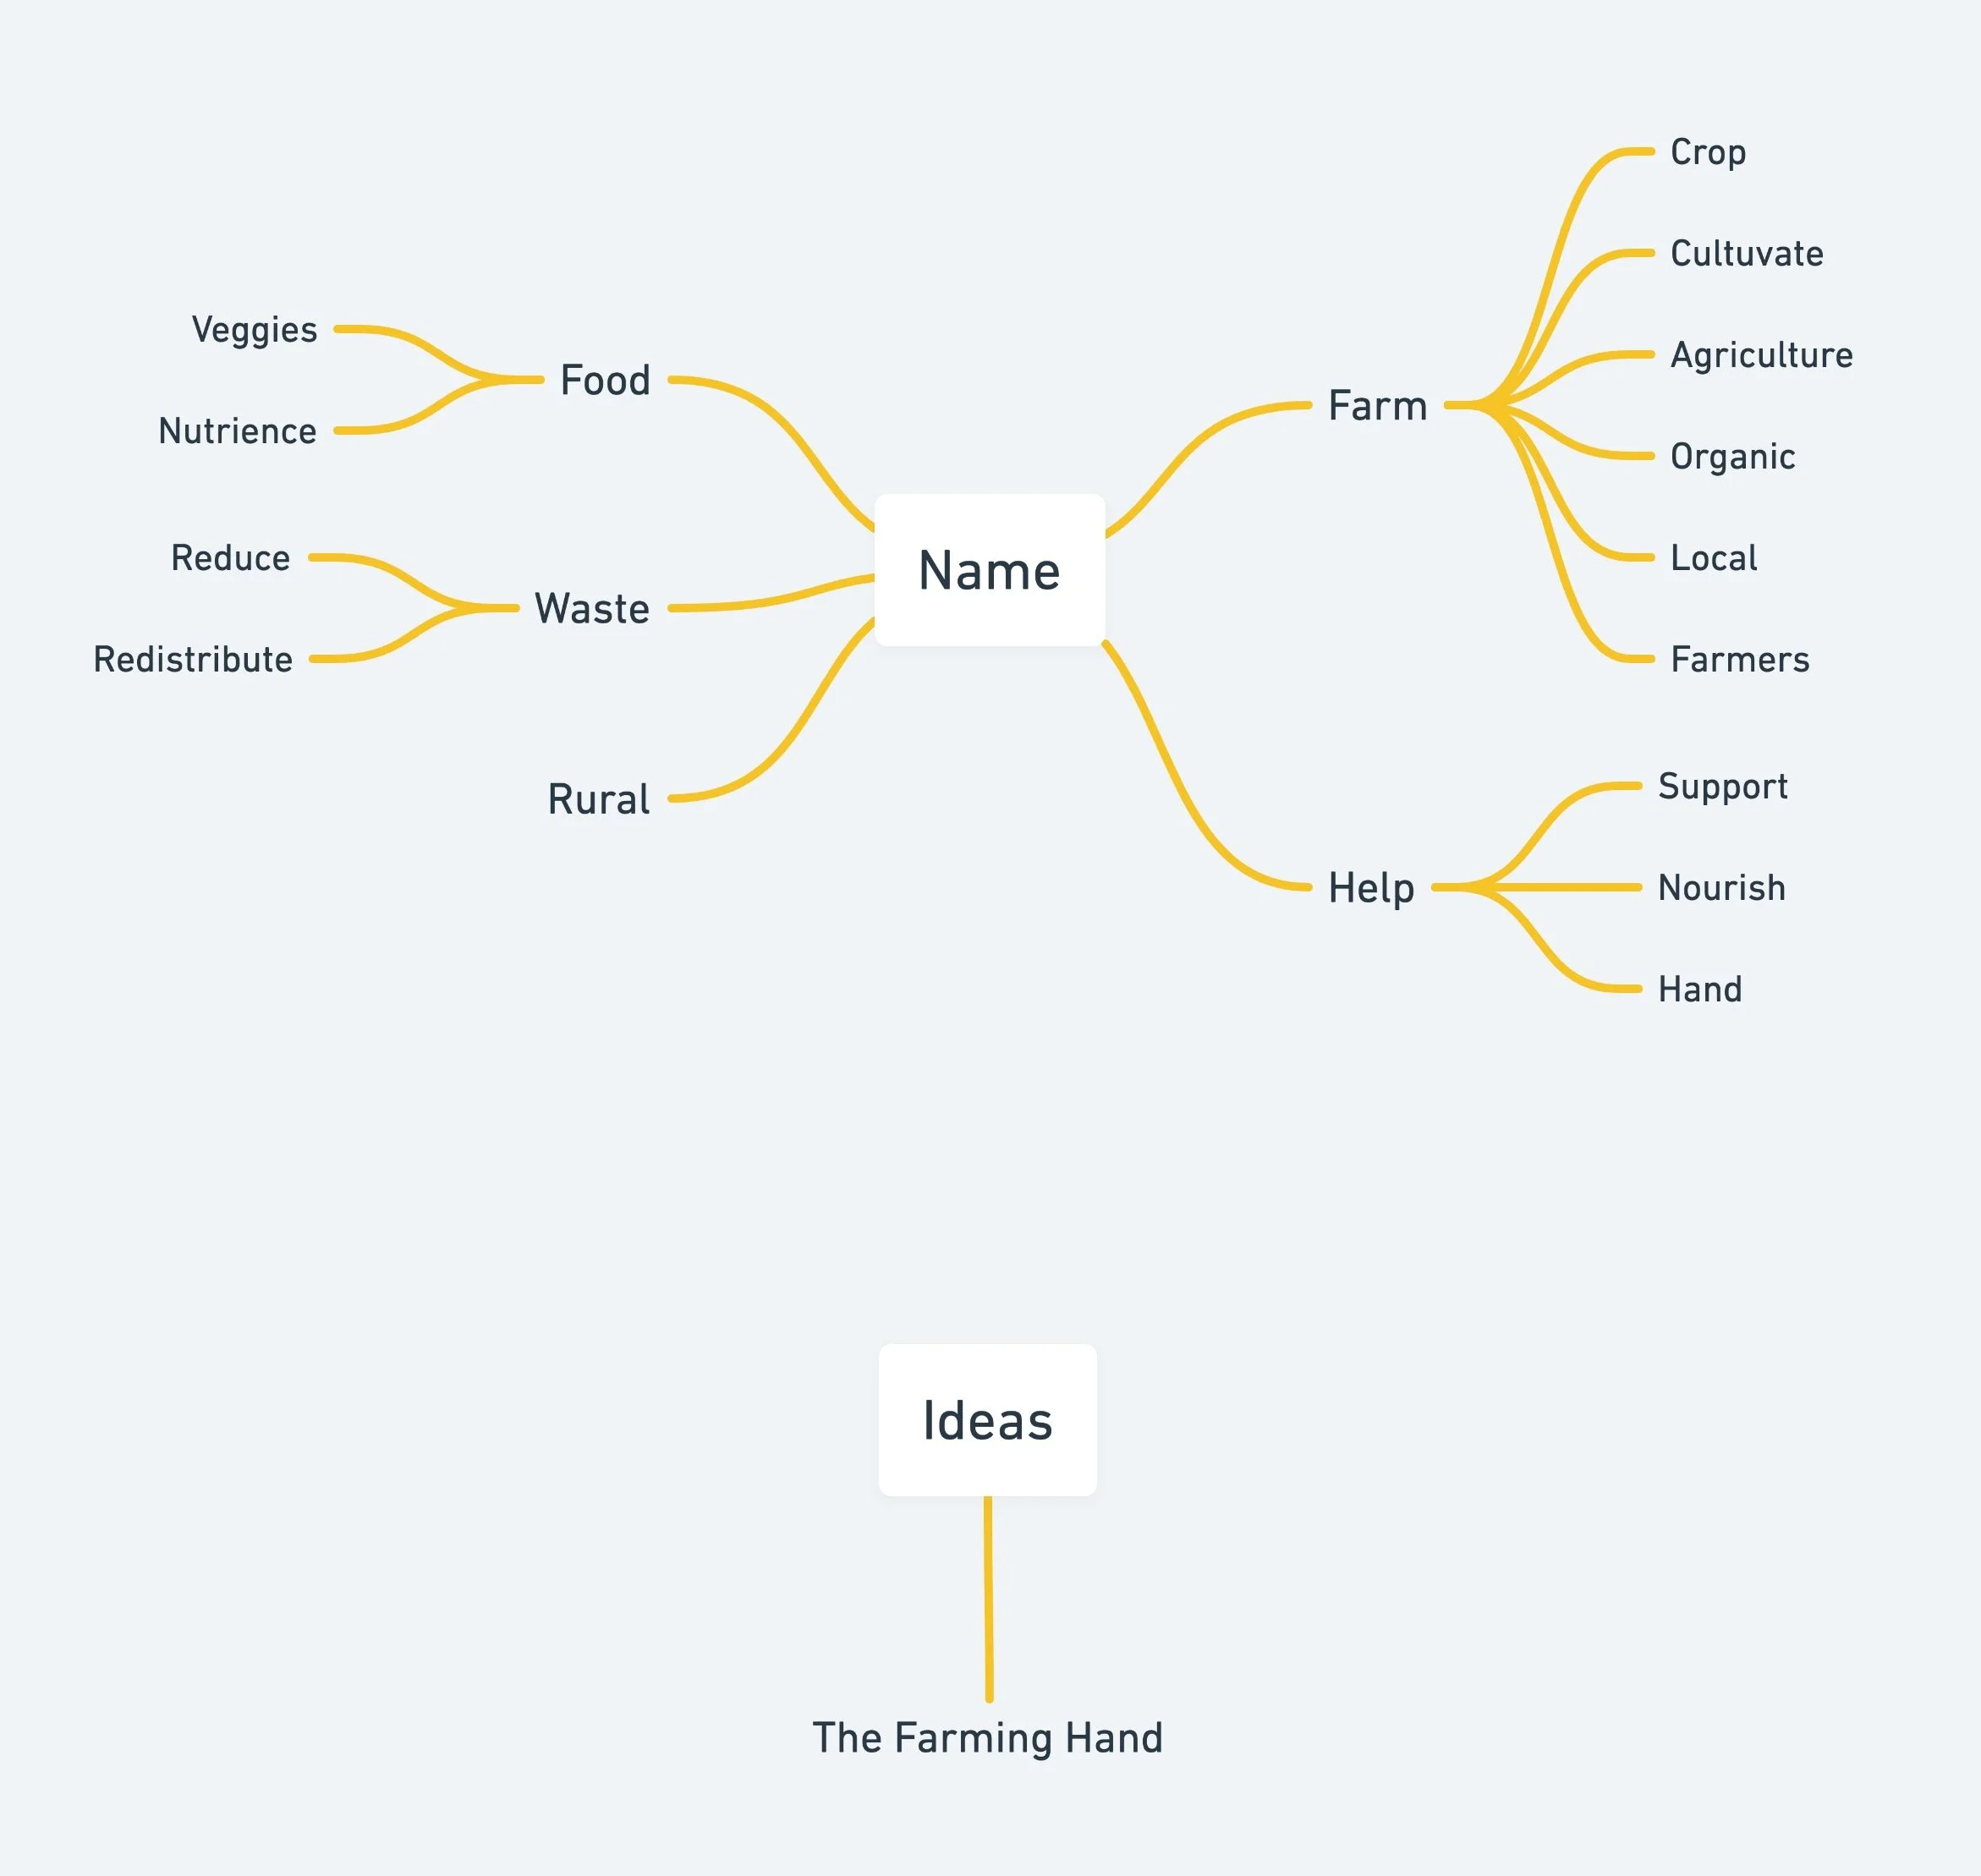
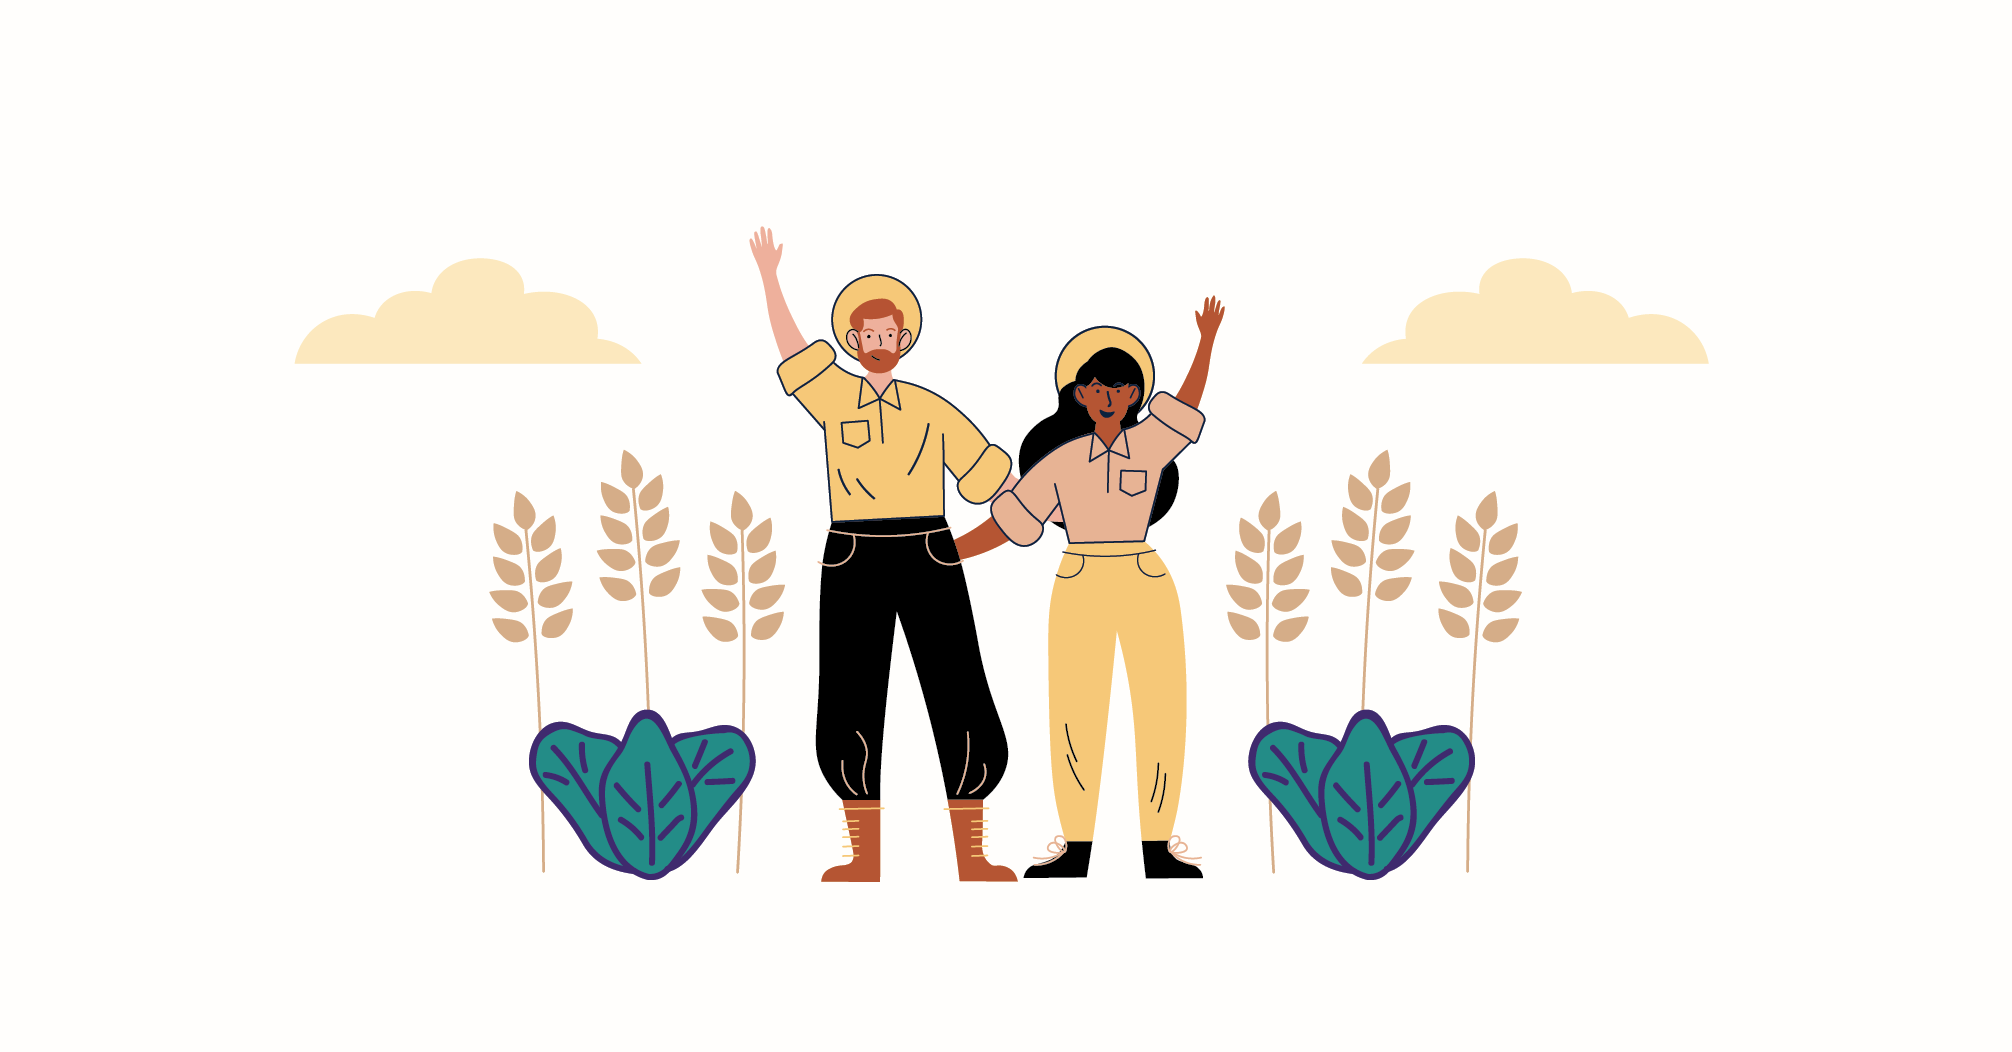
Friendly Illustrations

Interactive Prototype
The interactive prototype can be accessed here via Xd.

Takeaway
I explored how design could help fight food waste through smarter redistribution. Our team focused on environmental impact and community nourishment, aiming to make surplus produce useful for those in need.
Impact
Plotted helped me see how technology can connect surplus food with those who need it, reducing waste while supporting communities.
If I Had More Time
As a team it would be interesting to focus on improving real-time coordination between donors and recipients and making the process easier for everyone involved.